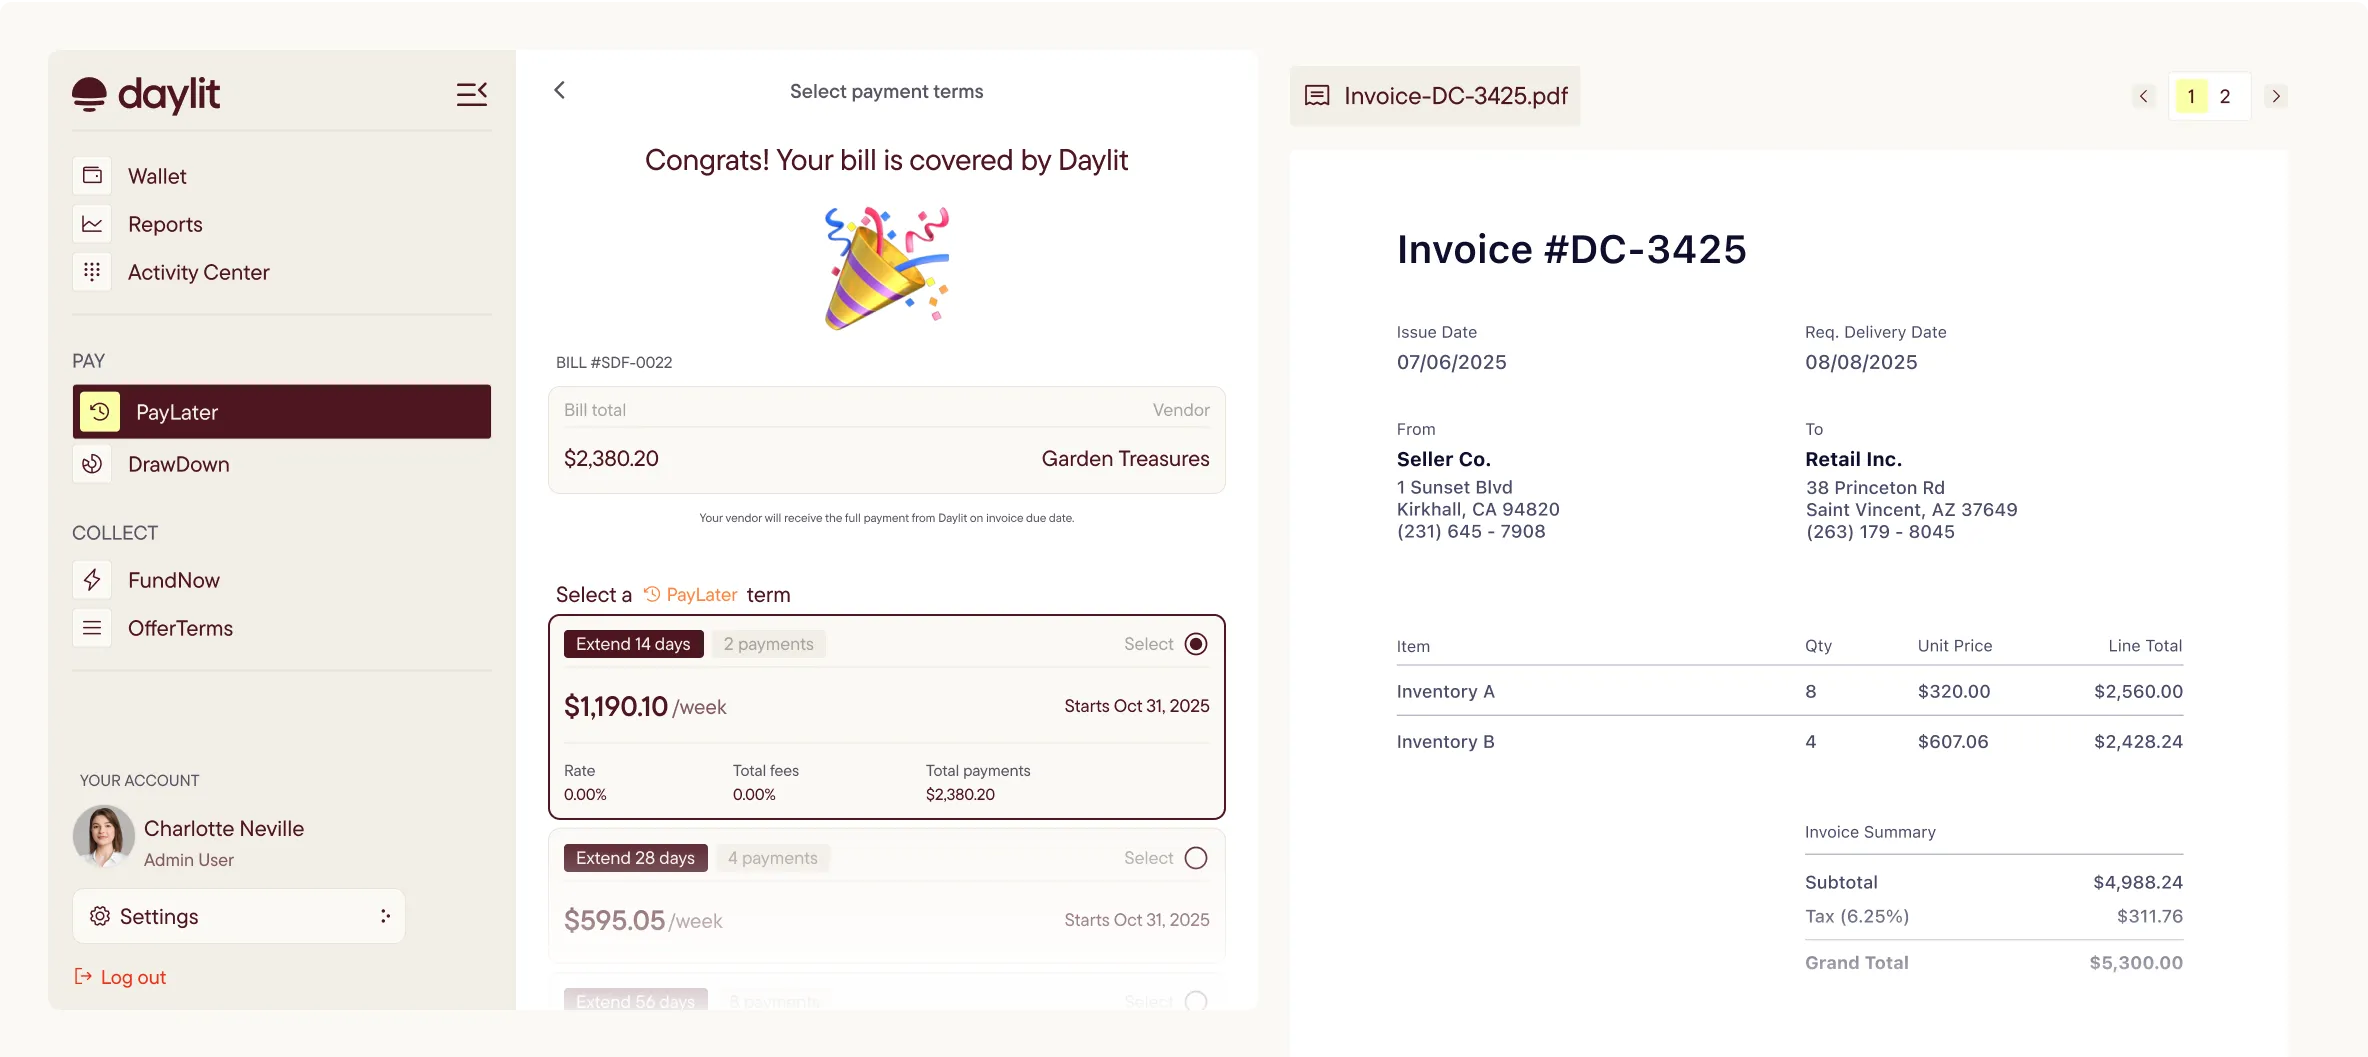
Introduction to Analytics Dashboard
The Daylit Analytics Dashboard provides users with comprehensive insights into their data. It allows for real-time analysis and reporting, making data-driven decisions easier.
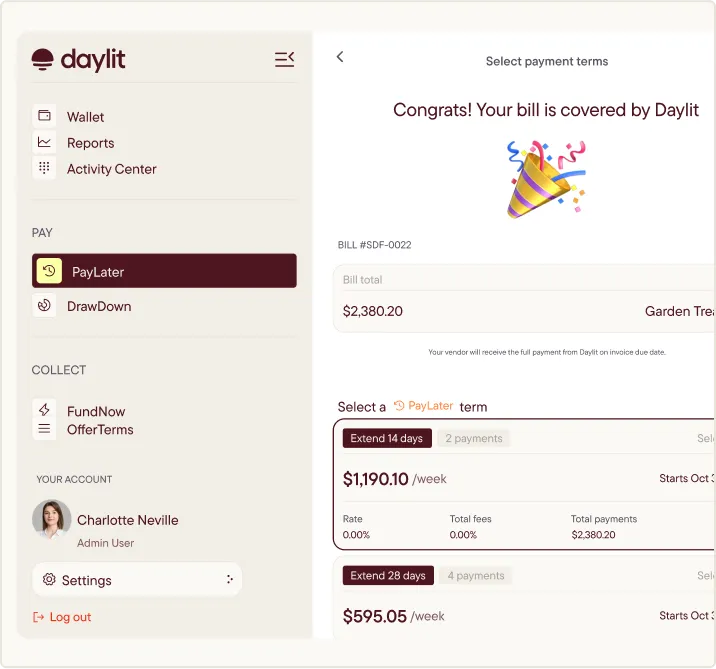
Features of Analytics Dashboard
This tool offers a range of features to help users understand their data:
- Real-Time Data: Access up-to-date information at any time.
- Custom Reports: Generate reports tailored to specific needs.
- Data Visualization: Use charts and graphs to visualize trends and patterns.
By leveraging the Analytics Dashboard, users can enhance their strategic planning and operational efficiency.